Games Won and Winning Margin
The most important stat in pro football is "Games Won." Our job is to find the important stats which separate winners from losers. The scoring difference (points scored on offense minus the points allowed on defense) creates the winning margin.
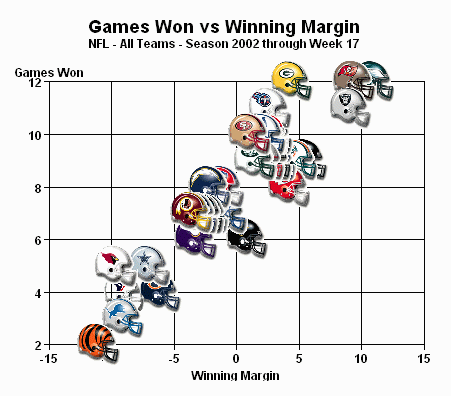
The chart below shows the linkage or association between games won and winning margin. The strongest teams are the Bucs, Raiders and Eagles whose average winning margin in the 2002 season was 10 points per game. The weakest teams were the Bengals, Lions, Bears, Cards, Cowboys and Texans, who lost by 5 to 10 points per game.
From the strongest to the weakest team helmet you can draw a straight line. Early in the season, using this line and a knowledge of the winning margin you can predict how many games a team will win.
In the chart below, you can see an average team will score as many points as it allows (winning margin = 0). Teams with winning margins near zero finish the season near 8-8.
Check this chart weekly to be the first kid on the block to know if your team is competitive.

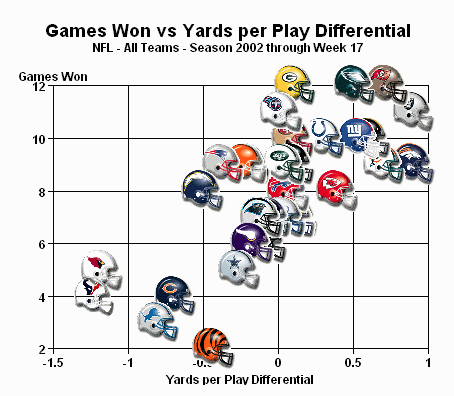
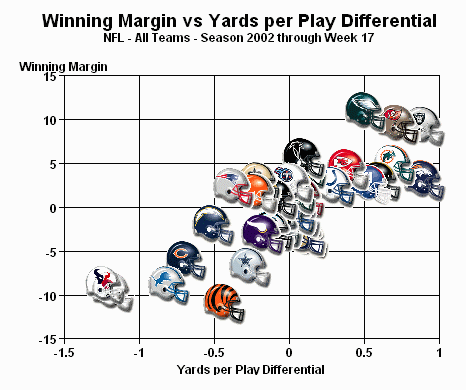
Here are two graphs: yards per play difference vs games won and yards per play difference vs winning margin. You can
see they are nearly the same. Yards per play is closely related to games won and winning margin. If a team wants to win, it must perform
well on yards per play. The most important stat is yards per pass attempt--see our Killer Stat.
| 


