Killer Stat II's Strong Link to Winning
If you want to predict divisional leaders,
Points per Pass Attempt does the best job. Divisional
winners, by definition, always make the playoffs. And once in the
playoffs, any team can reach the Super Bowl.
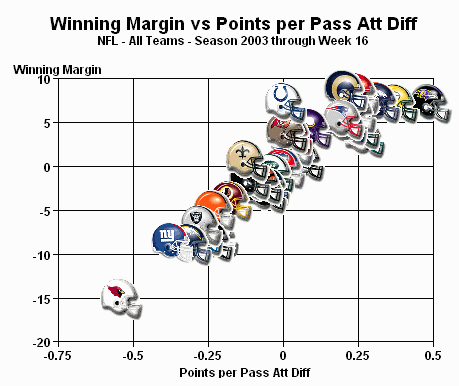
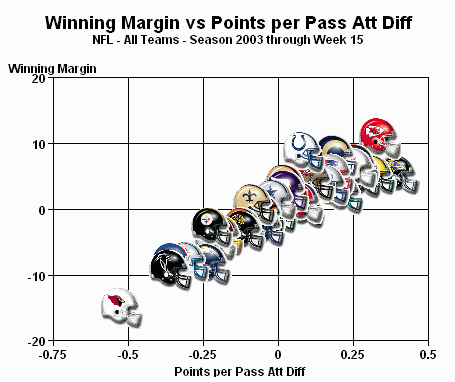
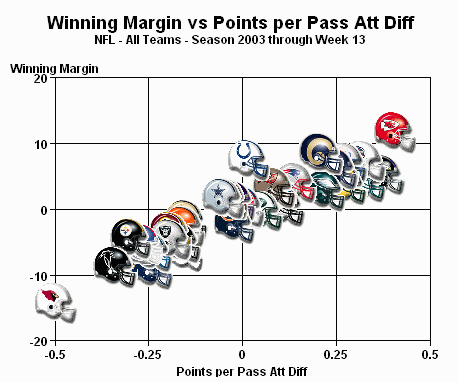
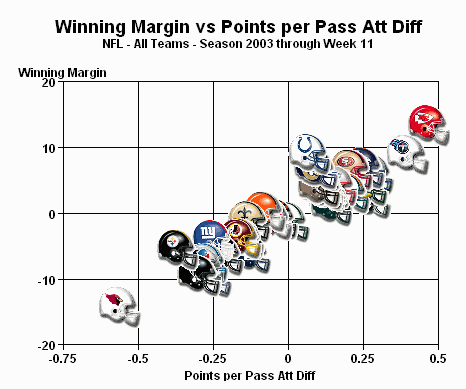
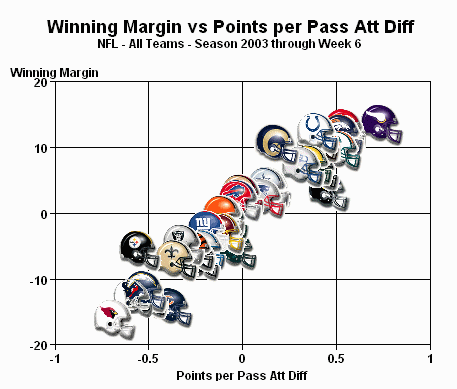
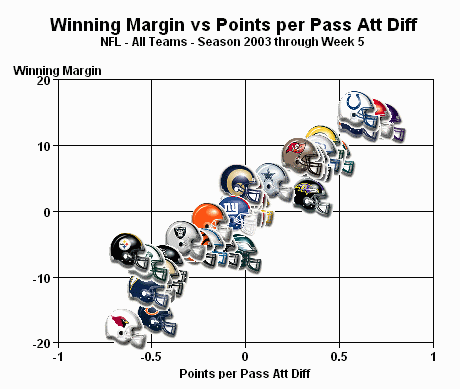
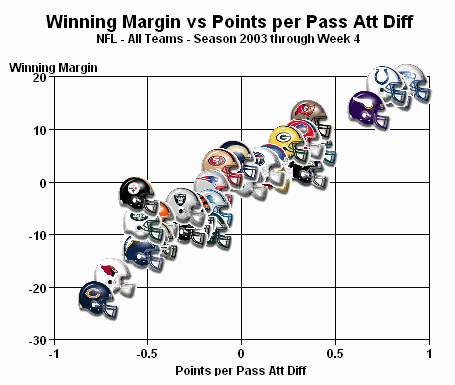
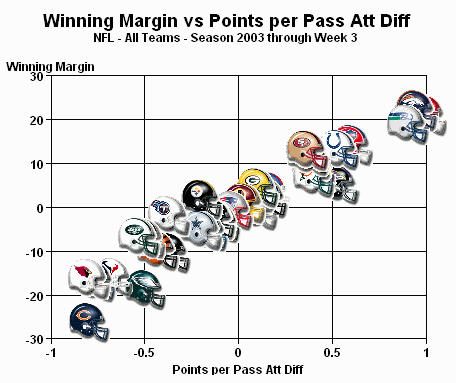
The graphs below show the close relationship between
points per pass and winning margin.
See current week conference charts:
AFC
NFC
Week 10 -
Week 10
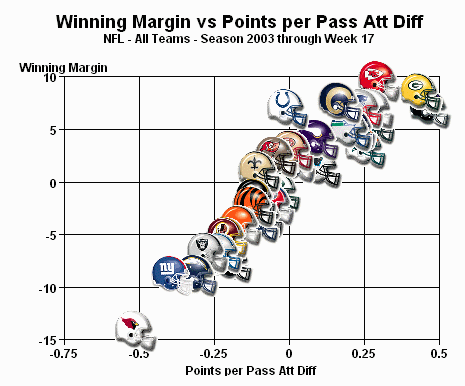
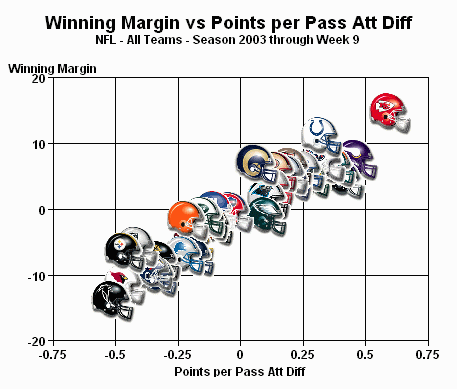
The helmet graphs charted here give you a chance to follow your team up and down the scale on Bud Goode's Killer Stat II, Points per
Pass. For example, this week the Kansas City Chiefs bombed the Cleveland Browns winning with an accurate long-ball game (41-20).
This big score bumped them up the scale extending their lead over the league (see chart above).
By comparison fans of the the Minnesota Vikings , upset in a 14-point loss to the chargers see their helmet dropping back into the crowd of
contenders. One big game, good or bad, can rocket teams up and down on Killer Stat II.
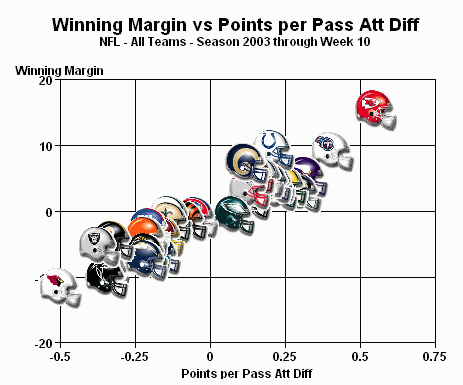
Example: scroll down to week 1 when the 49ers came out of the gate like Seabisquit to lead the league. They beat the lowly Bears by 42
points. Coming out of the blocks like the world's fastest man, they looked unbeatable. Since week 1 they haven't had a front runner call.
But the Chiefs picture a distance runner's staying power. Their position atop the league supports the electronic hardware's estimate as the
likely Super Bowl winner.
Bud Goode
Week 8 -
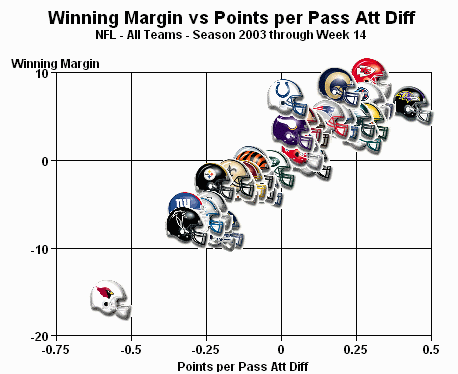
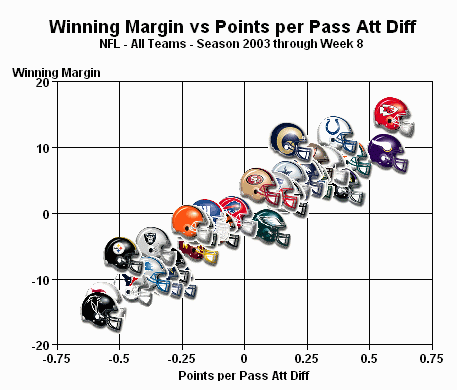
BudGoodeSports' home page features Killer Stat II, Points per Pass differential and pictures it's close linkage to a team's scoring differential (Winning Margin). With a knowledge of this one stat you can predict a team's average winning margin. Since Winning Margin is correlated 95% with Games Won you can also project any team's playoff hopes.
After 8 weeks, the Points per Pass picture shows the Chiefs are near the maximum value of 0.75. In the cellar (lower left corner) the Atlanta Falcons are near the max negative value (-0.75). The Falcons can't get to the playoffs from here.
To repeat, with a knowledge of this one stat you can project your team's playoff chances. Simply imagine a straight line connecting the
weakest team (Falcons) and the strongest (Coach Dick Vermeil's Chiefs). This line runs through the collection of team helmets.
Now find your team's helmet and draw another straight line across to the vertical axis where you find the "expected" winning margin. If
you are scoring as many points per pass on offense as you allow on D, then your points per pass stat reads "0". And a team with equal
balance on offense and defense will do just that, i.e., score as many points as they allow.
This "average" team will have an average W/L record (8-8).
Coach Vermeil went to the Super Bowl in 3 seasons at both the Eagles and Rams. He is now in his 3rd season at the Chiefs.
And projected to win the Super Bowl
(see the Scoring Projection report).
So if you want to grab an early handle on the playoff teams check this graphic each week.
Bud Goode
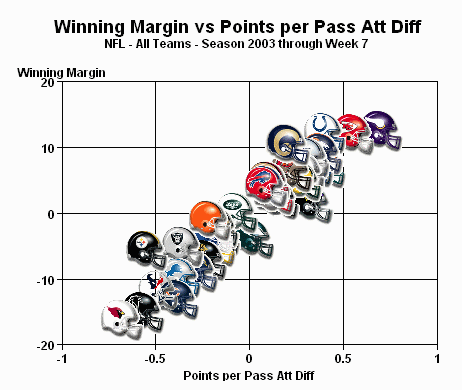
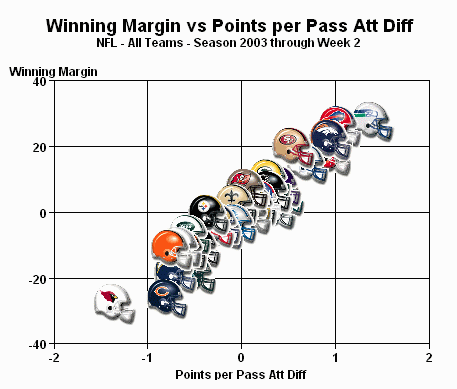
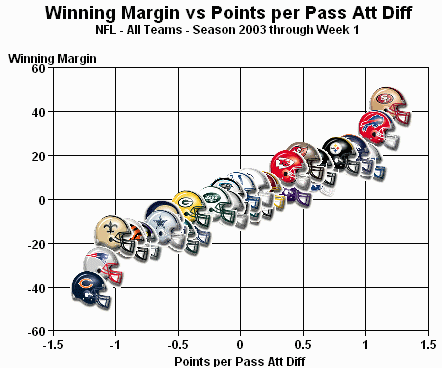
Example:
In the first week, San Francisco 49ers earned more than one point per pass
than their defense allowed and won by 40 points. The weakest team, Chicago
Bears (49ers' opponent) allowed more than one point than they earned on offense
and lost by 40.
Teams in the upper right corner are big winners on both stats.
The picture shows that as a team improves from zero to one point per pass or more
the winning margin explodes.
With a knowledge of this one stat you can predict winning margin and games won.
It will take 3 or 4 weeks before this picture settles down and the league's playoff
teams will be set in concrete.
To know if your team is playoff bound, check the Killer Stat II Divisional Charts feature every week.
Related items:
Copyright 2003, BudGoodeSports.com. All rights reserved.
| 
