Super Bowl Math
So how about a picture of the Super Bowl stats?
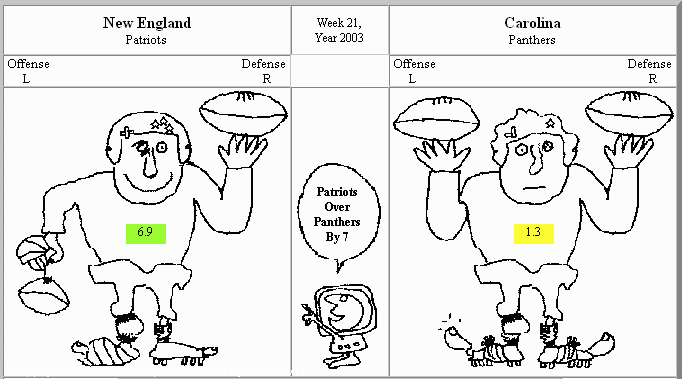
The strong, average and weak elements in the cartoon below picture
the strengths and weaknesses of the Pats and Panthers.
The left side of each player represents offense and the right defense.
The better the player looks, the strong the team.
|

Copyright 2004, BudGoodeSports.com. All rights reserved.
|
|
Legend - Elements |
Sacks: "Stars" on Helmet
Sacked Opponent QB: Nose |
| Fumbles Recovered: "Patch" on Helmet
|
Passes Intercepted: Left Eye
Opp. Passes Intercepted: Right Eye |
Yards per Pass Attempt: Left Arm
Opp. Yards per Pass Attempt: Right Arm |
Total Rushes: Left Leg
Opp. Rushes: Right Leg |
Field Goals: Left Toe
Opp. Field Goals: Right Toe |
Mouth: Average Points Difference
Jersey No.: Points Difference Value |
|
In the Patriots vs Panthers matchup, the cartoon above shows the
Panthers have an advantage on offensive yards per pass (left arm).
But the Patriots have advantages on defensive interceptions (right eye),
defensive sacks (nose) and fumbles recovered (helmet patch).
Based on the strength of the Patriots defense (an almost perfect-looking
right side of the Patriots' player), the computer character (middle) favors the
Patriots by 7.
Bud Goode
Copyright 2004, BudGoodeSports.com. All rights reserved.
|


