Star Charts: Tampa Bay vs Oakland
The star charts summarize the 6 key stats in any game.
There are three charts:
1. Bucs on offense (red line) and Raiders on D (blue line).
2. Bucs on defense and Raiders on offense.
3. The difference between offense and defense for both teams.
The star chart is easy to read: The lines range from the league's WEAKEST
(0 percentile, center of chart), through 50 (league average) and 100 percentile
(league's strongest, outermost circular grid mark).
The longer the line the STRONGER the team.
StarChart 1. Raiders Offense vs Bucs Defense
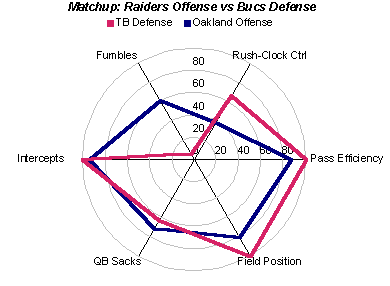
When the Bucs are on defense (red line) they have advantages on the
Rush-Clock Control group of stats.
All season it has been tough to run against the Bucs' D.
Reason why?
Warren Sapp weighs 310 pounds.
And he's quick.
Advantage to the Bucs D on Field Position.
The late Coach George Allen said, "I expect my teams to score on every third possession."
But turnovers frequently provide improved field position.
How often do you score in the red zone?
All the time?
Fifty percent of the time?
It certainly should be more frequent than Coach Allen's goal of one-in-three.
Advantage to the Bucs on Interceptions.
Pass pressure makes opposition QBs queasy.
This helps explain why INTs improve when QB sacks fall off.
How about the Raider advantages?
When the Bucs are on D the Raiders will
try to attack on the ground with Garner.
He's more dangerous as a receiver.
With speed, hands and more moves than a waterbed, in the playoffs
he's averaged 8.1 yards per catch.
And he catches everything.
That makes the short pass a great running play.
With the new 25-minute out of bounds rule (clock does not stop) all completions can be counted as ball
control stats.
Coach John Madden on the Monday Night Game of the Week talked with Eagles' Coach Andy Reid and reported,
"Coach Reid said last night the Eagles count every catch a running play."
So watch guys like smallish RB Charlie Garner (190 pounds) and "always open" Jerry Rice catch
short dump passes and make a bushel of first downs.
The star chart above also shows the Raiders have the offensive advantages on
fumbles and sacks.
StarChart 2. Bucs Offense vs Raiders Defense
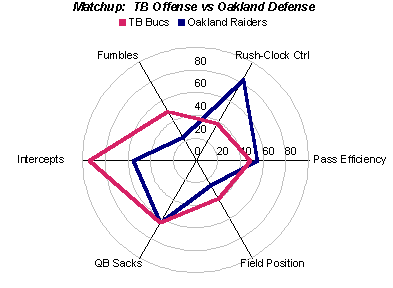
Now let's turn the page and put the Bucs on OFFENSE.
What are their statistical advantages?
Bucs on offense (red line) have advantage on interceptions, fumbles and
field position and the Raiders have the edge on
the rush-clock control group of stats and passing efficiency.
The two teams are equal on sacks.
StarChart 2. Bucs Offense vs Raiders Defense
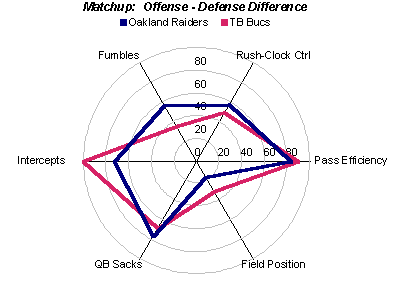
The summary chart combines both offense and defense computing the
"difference" between the two.
This chart offers a glimpse of the total stat profile.
In general, the larger the area covered by the team's stat profile, the
stronger the team.
It is clear from the star chart above, picturing the difference between offense
and defense, the two teams' advantages average out.
They are nearly equal.
If both play the game to their seasons' statistical form, it will be a
very close Sunday war.
(To see the predicted points advantages for the complete set of matched stats,
see the Graphic Matchups chart.)
Bud Goode and Bill Sanders
Copyright 2003, BudGoodeSports.com. All rights reserved.
|

