|
Points Per Pass: Killer Stat II (preseason)
All 8 Divisions
NFC East
This new season fans can predict the divisional playoff chances for all teams
(and thier favorite team) using our new Killer Stat II, Points per Pass.
Watch this feature weekly and early in the season you can "guesstimate" your team's playoff chances (after week 3 or 4).
Example: in the 1999 season, Coach Dick Vermeil's Rams stat profile predicted a Super Bowl victory after only two games.
The graphic below gives you the ability to predict any team's won-lost record.
Using Points per Pass as our most accurate stat, you can see from the NFC chart the Eagles and Giants were the two strongest
teams last year. Eagles won 12 games and the Giants 10.
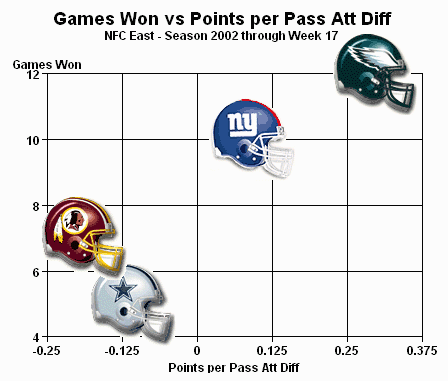
With a knowledge of Points per Pass you can place your favorite team in this pattern and estimate where your team will stand.
Personnel changes will move these teams up and down the won-lost scale. DE Hugh Douglass is out of the Eagles' defense but his
departure is matched by the return of RB Correl Buckhalter, 6'2" and SUV heavy and powerful. Buckhalter has "hands." Using both
Buckhalter and Staley as receivers is reminiscent of Muncie and Galbreath who led New Orleans to the top of our killer stat list
earning 7.1 yards per pass.
Can the absence of Douglass be made up by the emergence of a new ball control passing game? To slow the Eagles run at the Super
Bowl this imaginary ball control offense will have to be stopped.
Our Competition Computer projects won-lost records for the Eagles and Giants of 12-4 and 11-5. Both make the playoffs.
Redskins and Cowboys, the two weakest teams in the division are pictured at 7 and 5 wins last season. They did not add enough
to improve their stat profiles and challenge for playoff spots.
AFC East
The Redskins are favored over the Jets by only one point in the season kickoff Thursday night, Sept 4. The reason? Jets QB
Pennington's broken wrist will cost the Jets almost one TD per game. See Pennington Loss Costly to Jets
feature.
Last season Jets earned 149 rushing yards per game and the Redskins D allowed 134. Expect Jets Coach Herm Edwards to pound the ball.
Below, the AFC East stat graphic pictures the Dolphins and Jets as the strongest teams in the division on the key Killer Stat II, Points per
Pass. An "average" team will earn as much on offense as it allows on D (a zero difference). This projects an 8-8 season.
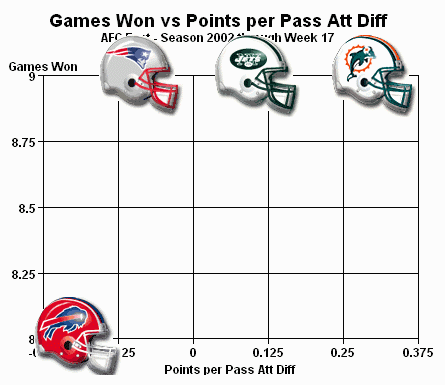
The competition computer projects Dolphins to finish the year with a 14-2 record, easily in the playoffs and potential AFC Super Bowl
team.
NFC North
As described above, fans can use the following NFC and AFC North division stat graphics to guestimate divisional playoff teams.
based on a knowledge of Points per Pass, you can accurately predict your team's won-lost record.
In the NFC North the Green Bay Packers (2002 final stats) earned on offense as many points per pass as their D allowed.
This produced a zip (0.0) points per pass.
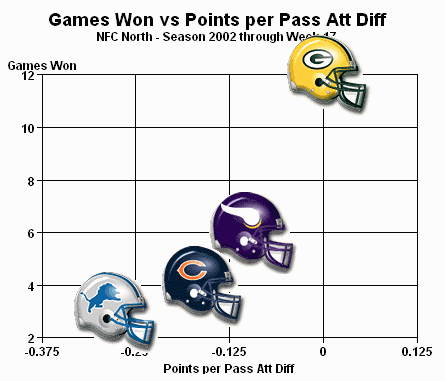
Usually this 0 performance value projects and 8-8 record. But the Packers made the playoffs with 12 Games Won (12-4 record).
They must have been strong elsewhere. Question: where did this seeming power originate? Answer: In the Packs' Level of Opposition.
Teams in their division were feelin' puny. The stat graphic shows the Pack faced the Lions, Bears and Vikes (all below average, 0 value)
These teams had a weak offense/defense balance on this highly predictive Points per Pass stat and were a long jump in distance from Green Bay.
The Pack played the league's 5th weakest sched (see 2002 vs 2003 Schedules. Who Benefits?). So the Packers were strong in their division and with average performance stats looked like kings. Not So.
In 2003 Packers still face a soft sched, 10th weakest. So QB Brett Favre and company are the most likely NFC North champ and playoff bound.
AFC North
Last season the Steelers won 10 games earning a little more on offense than their D allowed on the key Points per Pass stat. Typically this performance level projects a 9-7 W-L record. A close, but not exact, final Games Won performance for the Steelers.
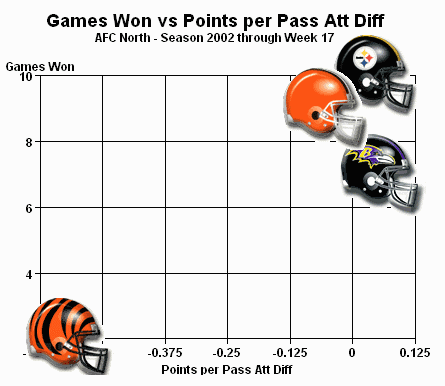
This stat graphic is a flipside version of the NFC North picture. There are 3 teams at the top of points per pass (Steelers, Browns and Ravens) and only one team (Bengals) at the bottom. The Bengals allowed 0.6 points more on D than their offense earned. Purely not competitve football--and didn't win a game in their division.
The Steelers are the likely division playoff leader. The Competition Computer projects a 9-7 W-L record.
AFC West
In the graph below last year's Super Bowl Oakland Raiders won more games
than their divisional competitors (Broncos, Chiefs and Chargers). And as divisional leaders made
it through the playoffs to the Super Bowl.
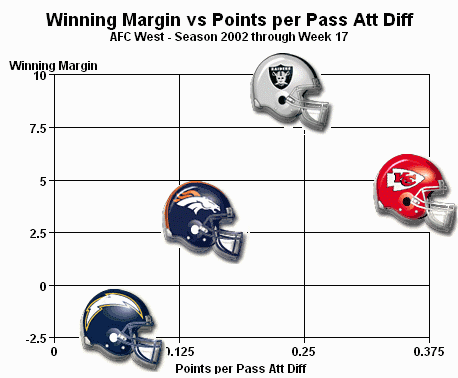
But note the Chiefs were stronger on Points per Pass (0.35). This stat
graphic says "With this powerful performance, ...the Chiefs should'a been in the playoffs."
Leaders on this stat, which accurately predicts a team's Games Won,
typically earn 0.50 points per toss (i.e.,a half-point per pass more on
offense than their D allows).
But injuries killed the Chiefs (we have already seen this happen to the Jets
and Falcons with injuries to QBs Vick and Pennington).
If the Chiefs stay healthy they will challenge the Raiders and Broncos for
divisional leader.
The Broncos are stronger than average, and likely to improve. But they have
a long road ahead to move up to 0.40 or 0.50 which
typically marks the performance of divisional leader
NFC North
A small secret that NFL insiders have tucked in their memory box is the
Killer Stat II info. If your team can earn a quarter-point per pass more on
offense than their D allows, you are on the road to the playoffs. If you add
only a quarter-point more (to 0.50) you are almost guaranteed to make the
playoffs. Reason why? Points per Pass is a most accurate predictor of
Games Won.
The stat graphic below shows that only the San Francisco 49ers were stronger
than league average of zero (earning more points per pass on
offense than allowed on D). This Competition Computer info suggests to match the leader and
make the playoffs the Rams, Seahawks and Cards have a long way to go.
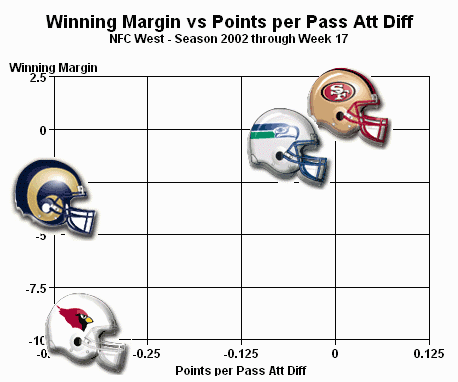
Possible? Yes. But chances are long and against huge up moves by these
three teams. The Ram's offense appears to be healthy again.
Coach Martz is an offensive genius. And QB Warner has a bow and arrow eye
for hitting his speedy WR duo, Torry Holt and Isaac Bruce in stride. Their
passing game is tough to stop.
But last year the Rams trailed the league on a key passing efficiency
stat (a stat we call "Passing Efficiency," consisting of sack yards plus INT return yards).
They had injuries in pass blocking
positions and QB Warner was not healthy. Can they match the leaders on this
stat? Trailing the league (9 points behind the leader) on any key
passing efficiency stat makes it tough to capture the divisional
leader spot.
And the Rams' D still needs help.
As the season begins, only the 49ers look to have the balance to become
divisional leaders. Check this feature weekly. You will be the first to
see if the Rams and Seahawks are in the race. As for the Cards, the low
position of the redbird's helmet suggests they are not competitive.
AFC South
Killer Stat II, Points per Pass, is a key to understanding the game. Since a team can't run and pass on the same play,
the more you run the
less you pass.
So, if points are held constant, as the number of rushing plays improves, the Points per pass stat goes through the roof.
With a knowledge of this stat you can predict the number of games won for any team. Come back to this feature each week and in a
glance you will see how your team will finish. Note: By the third or forth week the sample size will be large enough to make a good
guestimate of your team's W-L record.
The graph below shows the final standing of the 4 teams in the AFC South.
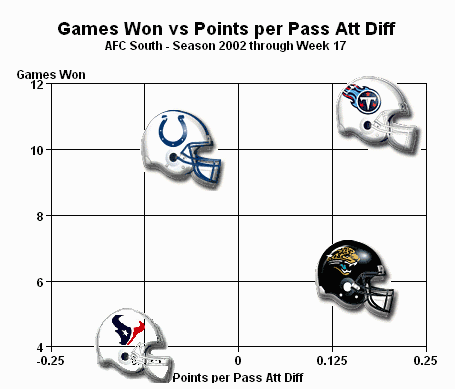
The Titans are the strongest on Points per Pass (difference) earning 0.20 of a point for each point their D allowed. Stronger
than average, the Titans won 11 games.
Jacksonville is nearly as strong earning almost 0.20 points for each D point allowed. They won only 6 games. We will discuss the reason
for this weak performance on Games Won next week.
The Colts are below average (below a 0 difference) allowing more points per pass than their offense earned. If they expect to challenge
for divisional leadership then they must improve.
The strongest teams on this key stat finish the season near 0.40. The Titans have the best chance of moving up. Coach Jeff Fisher has
improved his defense with a healthy (maybe) DE Kearse. Opening against the Raiders will challenge the Titans new D.
Our Competition Computer tabs the Raiders by 3.
NFC South
Our Killer Stat II, Points per Pass, gives every fan a chance to show off his football IQ. Points per Pass is the game's best stat for
predicting total Games Won.
The graph below shows the performance in year 2002 for the NFC South. If you want to predict the league's eight divisional leaders then
you can do it best with a quick weekly look at your team's division.
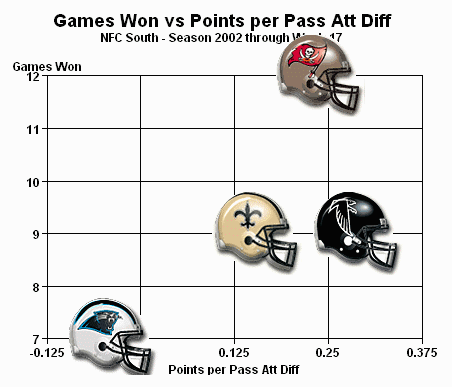
The Bucs and Falcons lead the division earning one-quarter point more on offense than their D allowed in 2002. In 2003's first Monday
night game, the divisional leading Bucs (+0.25) face the Eagles (+0.30). Eagles have an edge on Bud's Killer Stat.
It will be a great game. Both teams have suffered D injuries. And Coach John Gruden made a living last season with the best pass D in the
leauge. Tonight it will be a challenge with walking wounded trying to stop Eagle's QB McNabb.
Our general thoughts on the reasons why Points per Pass is such an important contributor to winning. First, it is not just a measure of
passing efficiency. Rather, it is more a measure of the run/pass balance. Since a team can't run and pass on the same play, the more you
run the less you pass. And when a team leads in any game, they stay on the ground to roll the clock.
So hidden in this points per passs stat is the fact that the team leading by a pack of points is moving on the ground with its heavy tanks
dominating the 60 minute game's time/space.
Watch the stat tonight. It's easy to compute. All you do is dvide points by attempts. Anything near one-point-to-one-pass is a sure winner.
Bud Goode and Bill Sanders
Copyright 2003, BudGoodeSports.com. All rights reserved.
| 


